Abstract:
This research shows how the ethanol process effect production in the sugar industry in UK & Pakistan. UK follows alcoholic process while Pakistan used a halal mode of production. This is a qualitative study. The data is collected through secondary sources. The primary data is gathered through an open-ended questionnaire. The goal of this project is to collect feedback from the targeted group in order to improve the feedback stage of the analysis model. Most of the quantitative data collected by the various organizations involved in the sugar industry are published by the World Bank, FAO, and research firms. The findings of the research show that the UK has more demand but less supply and imports is an alternative. But in Pakistan excess supply balance demand so exports of sugar can take place. But the difference in profitability is subject to lack of market information
Key Words:
Sugar Industry, Ethanol Process, UK, Pakistan
Introduction
Ethanol has incredible fuel properties for flash start interior ignition motors; for instance, its high octane and high warmth of vaporization make the liquor more proficient as an unadulterated fuel than gas. Since ethanol is less unpredictable than gas (Bailey, 1996) and has a low photochemical reactivity in the air, brown haze arrangement from evaporative discharges of unadulterated ethanol can be not exactly for gas. Ethanol can likewise be mixed with gas to lessen gas utilization, improve octane, and advance increasingly total ignition. Be that as it may, non-perfect communications with gas cause the vapor strain to expand some for low-dimension ethanol mixes (about 10%), yet the vapor weight of the mixing gas could be decreased to make up for this impact. Ethanol has a low danger, especially in contrast with different energizes, and is promptly biodegradable in water and soils, lessening entrance of tufts from holes and results of spills thought about to oil based powers.
In this examination, the generation of ethanol from sweet sorghum was explored as a pathway to a couple utilization of new and built-up innovations for conceivable application to the developing ethanol advertise in UK and Pakistan. Specifically, a situation was assessed to mature the sugar new and set up advancements for conceivable application to the developing ethanol advertise in China. Specifically, a situation was assessed to age the sugar the leftover sorghum bagasse cellulosic portion to ethanol while consuming the residuals (for the most part lignin) for warmth and power. This methodology was contrasted with customary strategies which is polished in Pakistan for separating sugar available to be purchased or transformation to ethanol and consuming the bagasse for warmth and capacity to decide whether ethanol creation from the two parts offered a potential financial favorable position. Also, another situation was considered of selling the sugar from sorghum squeeze and changing over the bagasse to ethanol with the leftover lignin again consumed for warmth and power. Cellulosic ethanol innovation as portrayed by the National Renewable Energy Laboratory
So there are various chemical process used in making sugar in sugar industries how the difference in operations leads to change in production and what are the factors effecting sugar production and ethanol generation?
Literature Review Sugar Industry in Pakistan
In Pakistan, sugarcane is an essential component of the country's economy. It is ranked 15th in the world in terms of sugar generation and 60th in yield. It is additionally developed over a million hectares, which gives the country's 84 sugar plants the crude materials needed to produce high-quality products. The sugar division accounts for 4.2% of the country's production. The size of the segment dictates the concrete part of the overall structure. The industry has a significant financial impact on the economy, as it is both regressive and forward-linked.
The country's sugar production during the 2007/08 season was evaluated at 61.5 million metric tons, which is 12% higher than the previous year. Due to the increase in the area under development, the yield also went up. However, during the 2008/09 season, the production of sugar was estimated at 55 million tons, which is 10% lower than the previous year. According to reports, the country's sugar production during the upcoming season is expected to be around 3 million tons. The country's annual sugar utilization rate is estimated to be between 3.6 and 4.2 million tons. Authorities of the industry state that the decline in usage was caused by the high prices and a monetary log jam. Despite this, the region under development for sugarcane has seen a slight decrease in production, but ranchers are expecting a better yield due to the improved variety of seeds. Due to the increasing cost of sugar and the lack of supply, Pakistan has to import the commodity to meet its needs.
Sugar industry UK
Since the UK started importing sugar from other Commonwealth nations, such as Australia, South Africa, and the British West Indies, the country has been able to rely on these countries for a steady supply of refined sugar. With the exception of two, the East African domains have been heavily reliant on the production of crude sugar. They were also very happy to maintain the low prices that had been seen in the advertising for many years. When Britain joined the European Union in 1973, a special import program for sugar was established that was agreed with the conventional producing nations of the EEC and the African, Caribbean, and Pacific (ACP) nations. The protocol, which became known as the "ACP Sugar Protocol," was established based on the 1975 Lomé Convention.
This estimate took into account the special access granted to the EU to advertise 1.3 million tons of suga at a rate that was close to the price of crude sugar. This access has remained a part of the EU's advertise approach, which has changed over time. The special access granted to sugar producers through the protocol has had a significant impact on the speculations about the value of land, HR, and capital in various countries. The profits generated by the protocol have been used to fund the governments' financial plans. It has also contributed to the exchange rate adjustment and the development of a comprehensive financial exchange. Some of the sugar companies have used the profits generated by the protocol to fund the modernization of their operations. They have also used the funds for the development of other projects.
Theoretical frame work
Above literature possess the following frame work
Methodology
The study is analyzing the impact of ethanol production in the sugar industry of Pakistan and the UK.
Research Design
This exploration is a sort of work area investigate. As depicted by the name Desk Research is the examination framework which is on a very basic level picked up by sitting at a work area. The concept of work area examine is related to the data collected from various sources for social affair analysis. It is regarded as a minimal exertion technique that is usually focused on keeping up with the changes in the status of the situation.
It can be pointless for a specialist to carry out a work area to examine if he or she doesn't have the necessary data to make an informed decision. In the event that the data collected is not sufficient, the procedure can be easily ruined. Work area inquiry about is very effective because it can be driven by the amount of factual looking over that is available in the investigation. There are two sorts of work area inquire about procedures:
? Internal desk research in which research is take place inside of the under-consideration organization.
? External desk research is a type of research in which data or information gathered outside the boundaries of understudy organization such as online data existing governmental policies and gathering information from different existing research materials.
So, this research follows external or internal desk research. Analysis based on information gathering from industries so we observed industry by taking one experimental group the group of sugar can industries where ethanol is used as a technology of production and the group of industries where ethanol not used and some other alternatives used. Ethanol is considered to be a prohibited commodity (HARAM) in Islam. So sugar-cane industries in all Muslim countries must follow some other alternatives. So we have two groups of industries (1) Experimental group is the group where ethanol technology is used, this group is totally UK based we take a sample of some UK renowned sugar industries where ethanol used as a mode of production and observe the industry profitability cost employee convinces and other factors as well. (2) Control group similarly control group is a sample of sugar-cane industries where ethanol is not used as a mode of production this group is taken from Pakistan.
Experimental & Control Group
A trial bunch is a gathering that gets a test or procedure. It displays the changes in the free factor that has been attempted. The result and the estimations of the poor variable are then recorded. A test can additionally be joined with other test groups at the same time.
A control bunch is made up of individuals who are disinterested in the whole test, and the self-governing factor that was attempted cannot affect the outcome. This prevents the free factor from directly influencing the results.
Research Objective
i) What are the factors affecting Sugar production in the United Kingdom and Pakistan respectively?
ii) What are the possible impacts (If any) of Ethanol production on the sugar industry in the UK and Pakistan? And how changed the level of ethanol production will have or will not have any impact on the sugar industry in the United Kingdom and Pakistan?
iii) What are the available mitigation alternatives to reduce or eliminate the impact of the Ethanol industry on the sugar industry in the UK and Pakistan and how Ethanol production and sugar production can be made sustainable and viable?
Data collection
In this research, analytical and qualitative methods are used. By the help of previous researches and studies, we can predict a possible future situation. Whereas, the collection of data is done by primary and secondary means. The secondary source of data mostly consists of books, journals, articles, internet sources, and other academic websites were used to collect the relevant data. For the collection of primary data, we have design a questioner that consist of open-ended questions. These questionnaires were filled by the people of the discussed industries, by sorting out them on social media like Facebook. In order to check the feed back stage in both groups' experimental and control analysis model we develop the questionnaire to collect feedback of the targeted group. The most of the sugar cane quantitative data itself or sugar production is published by the research firms, FAO, World Bank and local governments. Qualitative data are often published by a few companies around the globe. The data with regards to Pakistan is somehow limited or out of date but UK data is available through Defra, the UK government. The semi-structured interviews were conducted from sugar cane farmers in Pakistan, Sugar mills in Pakistan, ethanol distilleries in Pakistan, National farmer Union for the UK for sugar beet growers. Sugar producing companies in the UK and Ethanol producers in the UK on the ground for the validation of the publication content. Primary, Official and secondary data was collected to establish and apply an analytical framework finding the major sugar cane producers driver in UK and Pakistan. The framework will explain the factors affecting sugar industry in UK and Pakistan.
Targeted Population/ Sampling
As this research emphasises on studying the impact of Ethanol production on the sugar industry by conducting a comparative analysis between the UK and Pakistan, the sugar industries of both countries were targeted to gather primary data. Furthermore, the ethanol production departments of both the companies were targeted and employees having high level of experience in these production departments were targeted for this research. Interviewees would be conducted by the following companies of the UK and Pakistan and we conduct a survey and collect data:
? UK based Ethanol Industries
? UK based Sugar Industry
? Pakistan Sugar Mills
? Pakistan Ethanol Distilleries
? PEMA - Pakistan Ethanol Manufacturers Association
? PSMA- Pakistan Sugar mills association
? NFU- National farmers union UK
? Farmers of Pakistan
Methodology of Comparison
The research methodology used in this project involves converting all qualitative data into the quantitative form. Data collected from secondary sources and primary sources is then converted into a single-scale format. The project conducted 47 semi-structured interviews with key stakeholder groups in the sugar cane industry from June 2017 to November 2018. These included managers of sugar mills, the National Farmer Union, the owners of ethanol facilities, and experts in the field. The interviews were focused on various aspects of the industry's potential impact on ethanol production. However, in this case, we will be looking into the factors that influence the sugar production.
The collected data will be used to provide a comprehensive analysis of the current state of the ethanol and sugar markets.
Table 1. Formulation of Liker- scale
|
Likert-scale |
1 |
2 |
3 |
4 |
5 |
comparison |
|
Production
from your plant |
Not effective |
Less effective |
neutral |
effective |
Most effective |
Experimental/Control group |
|
Market
information |
Effective |
Less effective |
neutral |
effective |
Most effective |
Experimental/Control group |
|
Management strategies |
Effective |
Less effective |
neutral |
effective |
Most effective |
Experimental/control group |
5 The model
In order to find out the impact of ethanol on the sugar industries of both group experimental (UK based industries) and control group (Pakistan based industries) we run binary logistic regression of Dummy variables and made a binary coding of the two groups.
?=PP?1+MI?2+MS?3+?
Y= Sugar industries of both group 1= experimental group (UK) or 0 = if control group (Pakistan)
PP= production plan which we convert in to likert- scale all qualitative information we convert in to numeric by using coding formula.
MI= Market information
MS= Marketing strategies.
Binary Logistic Regression
A Logistic Regression is a statistical method that is used to estimate the relationship between various factors and their explanatory variables. It can be used to supplement the traditional linear regression process. In this method, the connection between the multiple independent variables and the expected variable is then established. For instance, the sex ratio, reaction time, and score are all predicted using Logistic Regression. The requirements for logistic regression are two independent variables. These can be indicators or IVs, which can be consistent or all out. All of the indicator variables are evaluated in one square to determine their predictive capacity.
Results
This section manages the analysis and understanding of the information. In this chapter the most important steps logical exploration. Without these step generalizations and forecasts can't be made, which is a definitive target of deductive examination. The most important thing is that generalization and conclusion are drawn on the foundation of aspects and disposition of the respondents. At the first section this study explore relationship and difference between the experimental (UK) and control group (pak) by using regression and correlation matrix comparing means techniques later on second section explore the difference in sugar production which uses ethanol as a mode of production of sugar.
Hypothesis Testing
H0= There is no significant impact of ethanol in sugar industry productivity (UK, Pak)
H0= There is no significant differences in experimental and control groups
H0 = alternative mode (other than ethanol) not have a significant difference.
Pestle’ Analysis
To analyse the factors affecting Sugar production in UK and Pakistan, Pestle analysis will be applied on the secondary data and then on the primary data for UK and Pakistan. Two separate sections will be presented and finally the comparative analysis of the both country. Further demand and supply analysis will be applied to predict the future forecast for sugar production by assuming ethanol production to increase by 25%, 50% and 100% respectively.
Table 2. Statistics
|
|
UK and Pakistan |
production from your plant |
market information |
market strategies |
|
|
N |
Valid |
259 |
259 |
259 |
259 |
|
Missing |
0 |
0 |
0 |
0 |
|
|
“Mean” |
|
2.52 |
2.60 |
2.58 |
|
|
“Median” |
|
2.00 |
2.00 |
2.00 |
|
|
“Variance’ |
|
1.840 |
2.016 |
1.811 |
|
|
“Range” |
|
4 |
4 |
4 |
|
|
“Minimum” |
|
1 |
1 |
1 |
|
|
“Maximum” |
|
5 |
5 |
5 |
|
Here, the Statistics
table demonstrates that there are 256 substantial and 0 missing qualities. It
likewise demonstrates the Mode measurement: here, the mode esteem is
"1", which is the numeric code for the experimental & control
group. Notice that the Mode measurement isn't showing the esteem names, despite
the fact that they have been doled out. (Thus, we suggest not mentioning the
mode measurement; rather, decide the mode from the recurrence table.)
Frequency Table
The Frequency portion indicates what number of recognitions fell into the given arrangement.
The precedent contained a total of 259 understudies' sugar ventures. Of those understudies, 104 did not utilize ethanol. The % fragment demonstrates the dimension of recognitions in that industry out everything being equivalent (both missing and nonmissing). You can check the degrees for each social affair by secluding its incorporation into the "recurrence" area by the motivating force in the last segment of the table.
? UK industry: 155/259 = 59.8.8%
? Pakistan Industry: 104/259 = 40.1%
The Valid % segment shows the level of perceptions in that classification out of the all-out number of non-missing reactions. You can confirm the extents for each gathering by partitioning it's included in the "frequancy" section by the estimation of "All out" that shows up after the last substantial classification . The Cumulative % section is the all-out level of the example that has been represented up to that push; it tends to be figured by including the majority of the numbers in the Valid % segment.
Table 3. UK and Pakistan
|
|
Frequency |
% |
Valid % |
Cumulative % |
|
|
Valid |
UK |
155 |
59.8 |
59.8 |
59.8 |
|
Pakistan |
104 |
40.2 |
40.2 |
100.0 |
|
|
Total |
259 |
100.0 |
100.0 |
|
|
UK has more production
in plant more market information and most accurate market strategies than
Pakistan. So the experimental group which is using ethanol as a mode of
production is more technically advance than Pakistan which is the control
group. Statistics shows that PP plant production is 13% effective Market
information is 16% while Market strategies is 12% effective in sugar industry
in control (PAK) or experimental group (UK). So I concluded that Market
information is the most important factor to determine the ethanol uses as a
mode of production of the sugar industry. It's somehow very important because
in Pakistan mostly Muslim community prefer halal items in food nonalcoholic
means of production should be preferred usually.
Table 4. Production from your plant
|
|
Frequancy |
% |
Valid % |
Cumulative % |
|
|
Valid |
Not effective |
73 |
28.2 |
28.2 |
28.2 |
|
Less effective |
79 |
30.5 |
30.5 |
58.7 |
|
|
uncertain |
39 |
15.1 |
15.1 |
73.7 |
|
|
effective |
36 |
13.9 |
13.9 |
87.6 |
|
|
Most effective |
32 |
12.4 |
12.4 |
100.0 |
|
|
Total |
259 |
100.0 |
100.0 |
|
|
Table 5. market information
|
|
Frequancy |
% |
Valid % |
Cumulative % |
|
|
Valid |
Not effective |
72 |
27.8 |
27.8 |
27.8 |
|
Less effective |
76 |
29.3 |
29.3 |
57.1 |
|
|
uncertain |
36 |
13.9 |
13.9 |
71.0 |
|
|
effective |
34 |
13.1 |
13.1 |
84.2 |
|
|
Most effective |
41 |
15.8 |
15.8 |
100.0 |
|
|
Total |
259 |
100.0 |
100.0 |
|
|
Table 6. market strategies
|
|
Frequancy |
% |
Valid % |
Cumulative % |
|
|
Valid |
Not effective |
69 |
26.6 |
26.6 |
26.6 |
|
Less effective |
72 |
27.8 |
27.8 |
54.4 |
|
|
uncertain |
49 |
18.9 |
18.9 |
73.4 |
|
|
effective |
37 |
14.3 |
14.3 |
87.6 |
|
|
Most effective |
32 |
12.4 |
12.4 |
100.0 |
|
|
Total |
259 |
100.0 |
100.0 |
|
|
Ordinary Least square Analysis of possible impacts of ethanol production on the sugar industries of the UK and Pakistan
Once the impacts of ethanol sugar industry are established then further analysis will be applied to validate the claim. If there is no impact then future prediction will be done to predict how the increase production of ethanol will impact the sugar industry in future in UK and Pakistan. The possible scenarios of changing the production portfolio in UK and Pakistan will be considered. Thematic analysis will be done to get the synopsis of the interviews, then regression correlation will be done to understand the linkage between the 2 industries in UK and Pakistan. Value chain analysis will be applied to recognize the factor affecting sugar production in UK and Pakistan. Value chain analysis is a great tool to understand the key abilities and can identify the areas for improvement. An economic Life cycle assessment will be done based on the relation to check the effects of ethanol production on sugar production in UK and Pakistan. A quick LCA environmental Impact will also be carried out assess the environmental impacts to give the outer edge to the research. Scenario based analysis will be done to check possible effects on the future of the sugar industry. Finally Comparative analysis will be conducted for UK and Pakistan.
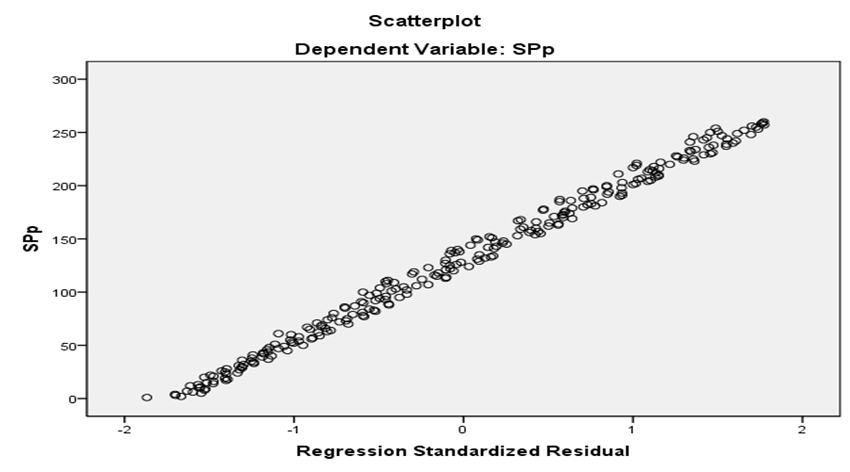
In order to check the relationship between ethanol on sugar industry we just take OLS method. These methods describe the relationship among factors that affect sugar industry in both countries respectively. We'll try to predict sugar industry production from all other variables by means of a ordinary regression analysis. Therefore, sugar industry is our criterion (or dependent variable). Ethanol is our predictors (or independent variables). The model is illustrated below. First, ordinary linear regression involves the association between the independent and dependent variables to be linear. The linearity assumption can be best to test with scatterplots. The subsequent case of ethanol which is an indicator of sugar production illustrates a curvilinear relationship.
The various phases of a relapse investigation require that the mistakes that were watched and anticipated are disseminated. This can be done by taking a look at a histogram or a quantitative quality plot. On the other hand, an integrity of fit test can additionally be utilized to check the typicality of the relapse.
A relapse that is straight is not affected by multi-collinearity. This occurs when the free factors that are connected with one another get too much. In this case, multi-colinearity was tried using the Correlation framework. The level of correlation coefficients that are related to the free factors was determined to be under
0.80. One of the possible steps in the investigation is to locate the data center.
To sum it up, subtract the sum of the free factors' mean score from the total. Analyzing the variables that cause multicollinearity is the most straightforward approach to eliminate them.
The last remaining doubt about the different direct relapse is the heteroscedasticity of the data. A scatter plot is an extraordinary way to check this. If the data is heteroscedastic, there should be no apparent precedent in the scattering. A non-linear extension of a term or change in the data's structure may settle the issue.
Table 7. Coefficientsa
|
Model |
Un-standardised Coefficients |
Standardised Coefficients |
t |
Sig. |
||
|
B |
Std. Error |
Beta |
||||
|
1 |
(Constant) |
167.980 |
27.081 |
|
6.203 |
.000 |
|
ethanol |
11.765 |
8.285 |
.088 |
1.420 |
.157 |
|
|
a. Dependent
Variable: SPp |
||||||

Results of above regression shows that there is very weak degree of association in ethanol and sugar industry that means there are some other mode of sugar production contributing in sugar industry. 1% increase ethanol cause 11% increase in sugar production. Degree of association between ethanol and sugar industry is just 4% and remaining 94% is due to some other factors.so we reject H0 that ethanol has no role in sugar industry in control or experimental group respectively.
Mitigation Measures to Manage the Potential Impacts
This would follow from the analysis and would try to identify possible measures that could ensure resilience of the sugar industry. The description of the activities associated with ethanol and its potential impact on sugar will be discussed along with the measure which could be taken to eliminate or decrease the impact of ethanol on sugar industry. Two separate tables will be created: one for UK and one for the Pakistan and in the end comparative analysis will be done to present the outcomes.
Binary Logistic Regression
In order to analyze the impact of ethanol on experimental and control group we used BLR.
Logistic Regression
The yield for Block 0 is derived from the intercept, which is referred to as the steady. Given the two options, 59% of the time the subject chooses to stop the examination, while 41% enable it. The best method is to anticipate that the subject will stop the examination, assuming that there is no other data.
Table 8. Case Processing Summary
|
Unweighted Casesa |
N |
% |
|
|
Selected Cases |
Included in Analysis |
259 |
100.0 |
|
Missing Cases |
0 |
.0 |
|
|
Total |
259 |
100.0 |
|
|
Unselected Cases |
0 |
.0 |
|
|
Total |
259 |
100.0 |
|
|
a. If weight is in effect,
see classification table for the total number of cases. |
|||
Table 9. Classification Tablea,b
|
|
Observed |
Predicted |
|||
|
UK and Pakistan |
%age Correct |
||||
|
Uk |
Pakistan |
||||
|
Step 0 |
UK and Pakistan |
Uk |
155 |
0 |
100.0 |
|
Pakistan |
104 |
0 |
.0 |
||
|
Overall %age |
|
|
59.8 |
||
|
a. Constant is included in
the model. |
|||||
|
b. The cut value is .500 |
|||||
The intercept-only model is shown in the variable section of the equation. If we divide the two sides of this expression into two, we get the predicted odds of the subjects deciding to continue the study. This means that the odds of the researchers continuing the study are .671. Since 187 of our subjects decided to stop the study, the observed odds are .684.
Table 10. Variables in the Equation
|
|
B |
S.E. |
Wald |
df |
Sig. |
Exp(B) |
|
|
Step 0 |
Constant |
-.399 |
.127 |
9.910 |
1 |
.002 |
.671 |
Presently take a ethonal at the Block 1 yield. Here SPSS has
included the sexual orientation variable as an indicator. Omnibus Tests of
Model Coefficients gives us a Chi-Square of 13.349 on 1 df, critical past .001.
This is a trial of the invalid theory that adding the ethonal variable to the
model has not essentially expanded our capacity to anticipate the choices made
by our subjects.
Table 11. Omnibus Tests of Model Coefficients
|
|
Chi-square |
df |
Sig. |
|
|
Step 1 |
Step |
13.349 |
13 |
.421 |
|
Block |
13.349 |
13 |
.421 |
|
|
Model |
13.349 |
13 |
.421 |
|
Table 12. Model Summary
|
Step |
-2
Log likelihood |
Cox
& Snell R Square |
Nagelkerke
R Square |
|
1 |
335.593a |
.050 |
.068 |
|
a. Estimation terminated at
iteration number 4 because parameter estimates changed by less than .001. |
|||
Table 13. Classification Tablea
|
|
Observed |
Predicted |
|||
|
UK and Pakistan |
%age Correct |
||||
|
Uk |
Pakistan |
||||
|
Step 1 |
UK and Pakistan |
Uk |
135 |
20 |
87.1 |
|
Pakistan |
76 |
28 |
26.9 |
||
|
Overall %age |
|
|
62.9 |
||
|
a. The cut value is .500 |
|||||
Under Model Summary we see that
the - 2 Log Likelihood measurement is 335.593. This measurement measures how
inadequately the model predicts the choices - the littler the measurement the
better the model. In spite of the fact that SPSS does not give us this
measurement for the model that had just the intercept, I know it to be 425.666.
Including the ethanol variable decreased the - 2 Log Likelihood measurement by
425.666 - 399.913 = 25.653, the ?2 measurement we just talked about in the past
section. The Cox and Snell R2 can be translated like R2 in a different relapse,
yet can't achieve a most extreme estimation of 1. The Nagelkerke R2 can achieve
a limit of 1. So we concluded that ethonal is 87% effective in UK sugar
industries but only 26% effective in Pakistan industries.
Comparing Means or comparative analysis of UK and Pakistan
The Compare Means system is valuable when
you need to outline and compare contrasts in expressive insights crosswise over at least one components, or straight out factors. The Statistics section of the left-hand menu shows the various types of measurements that are available. Some of these include the mean, standard deviations, middle, and gathered middle. Also, some of these measurements are known as standard mistakes, such as skewness, variance, and kurtosis. In the Cell Statistics section, the insights about the yield are delivered through the number of cases and the standard deviation. You can include extra insights by clicking and hauling them from the Statistics section to the Cell Statistics segment. You can likewise snap and drag things in the Cell Statistics segment to change the request they show up in the yield. The Statistics for First Layer region incorporates choices that will perform single direction ANOVA and figure straight fit insights (R, R2, Eta, and Eta Squared), separately.
Table 14. Report
|
production from your plant |
ethanol |
UK
and Pakistan |
SP |
|
|
Not effective |
Mean |
3.2740 |
|
124.10 |
|
N |
73 |
73 |
73 |
|
|
Std. Deviation |
.53111 |
|
75.849 |
|
|
Grouped Median |
3.4000 |
|
120.00 |
|
|
Sum |
239.00 |
|
9059 |
|
|
Less effective |
Mean |
3.2075 |
|
133.10 |
|
N |
79 |
79 |
79 |
|
|
Std. Deviation |
.58892 |
|
74.508 |
|
|
Grouped Median |
3.3267 |
|
138.00 |
|
|
Sum |
253.39 |
|
10515 |
|
|
uncertain |
Mean |
3.2128 |
|
132.59 |
|
N |
39 |
39 |
39 |
|
|
Std. Deviation |
.53300 |
|
76.681 |
|
|
Grouped Median |
3.3300 |
|
117.00 |
|
|
Sum |
125.30 |
|
5171 |
|
|
effective |
Mean |
3.2278 |
|
126.44 |
|
N |
36 |
36 |
36 |
|
|
Std. Deviation |
.52109 |
|
78.283 |
|
|
Grouped Median |
3.2800 |
|
122.50 |
|
|
Sum |
116.20 |
|
4552 |
|
|
Most effective |
Mean |
3.1278 |
|
137.44 |
|
N |
32 |
32 |
32 |
|
|
Std. Deviation |
.66230 |
|
72.453 |
|
|
Grouped Median |
3.1600 |
|
140.50 |
|
|
Sum |
100.09 |
|
4398 |
|
|
Total |
Mean |
3.2200 |
|
130.10 |
|
N |
259 |
259 |
259 |
|
|
Std. Deviation |
.56294 |
|
75.063 |
|
|
Grouped Median |
3.3300 |
|
130.00 |
|
|
Sum |
833.98 |
|
33695 |
|
As we compare the means value and standard deviation in UK and Pakistan we noticed that the distribution is not same. Production from plant in Pakistan is mean production different to mean production in UK. Mean production in UK is high as compare to Pakistan because of large scale industries.
Table 15. Measures of Association
|
|
R |
R
Squared |
Eta |
Eta
Squared |
|
ethanol * production from
your plant |
-.064 |
.004 |
.078 |
.006 |
|
SP * production from your
plant |
.037 |
.001 |
.063 |
.004 |
Table 16. Measures of Association
|
|
R |
R
Squared |
Eta |
Eta
Squared |
|
ethanol * market information |
-.070 |
.005 |
.150 |
.023 |
|
SP * market information |
-.003 |
.000 |
.100 |
.010 |
As we compare the means value and standard deviation in UK and Pakistan we noticed that the distribution is not same. Production from plant in Pakistan is mean market information different to mean mean market information to in UK. Mean market information in UK is high as compare to Pakistan because of large scale industries.
Table 17. Report
|
market strategies |
ethanol |
UK
and Pakistan |
SP |
|
|
strongly agree |
Mean |
3.1745 |
|
148.83 |
|
N |
69 |
69 |
69 |
|
|
Std. Deviation |
.56226 |
|
70.207 |
|
|
Grouped Median |
3.3000 |
|
156.00 |
|
|
Sum |
219.04 |
|
10269 |
|
|
agree |
Mean |
3.2500 |
|
130.24 |
|
N |
72 |
72 |
72 |
|
|
Std. Deviation |
.52202 |
|
77.237 |
|
|
Grouped Median |
3.3380 |
|
141.50 |
|
|
Sum |
234.00 |
|
9377 |
|
|
uncertain |
Mean |
3.3357 |
|
125.67 |
|
N |
49 |
49 |
49 |
|
|
Std. Deviation |
.56245 |
|
82.604 |
|
|
Grouped Median |
3.4700 |
|
128.00 |
|
|
Sum |
163.45 |
|
6158 |
|
|
disagree |
Mean |
3.1689 |
|
124.54 |
|
N |
37 |
37 |
37 |
|
|
Std. Deviation |
.55869 |
|
76.072 |
|
|
Grouped Median |
3.2700 |
|
125.00 |
|
|
Sum |
117.25 |
|
4608 |
|
|
strongly disagree |
Mean |
3.1325 |
|
102.59 |
|
N |
32 |
32 |
32 |
|
|
Std. Deviation |
.65471 |
|
59.185 |
|
|
Grouped Median |
3.3150 |
|
94.00 |
|
|
Sum |
100.24 |
|
3283 |
|
|
Total |
Mean |
3.2200 |
|
130.10 |
|
N |
259 |
259 |
259 |
|
|
Std. Deviation |
.56294 |
|
75.063 |
|
|
Grouped Median |
3.3300 |
|
130.00 |
|
|
Sum |
833.98 |
|
33695 |
|
Table 18. Measures of correlation
|
|
R |
R
Squared |
Eta |
Eta
Squared |
|
ethanol * market strategies |
-.017 |
.000 |
.121 |
.015 |
|
SP * market strategies |
-.175 |
.031 |
.186 |
.035 |
Every individual mean examination strategy is situated on a
submenu that is underneath the general Analysis Menu and is characterized as: =
Means: this component computes singular subgroup means and each related
univariate insights for some needy factors inside various classifications =
One-Sample T Test: this system tests if the mean of a different variable is
unique in relation to a solitary determined consistent number =
Independent-Samples T Test: this test compares means for a different pair of
cases = Paired-Samples T Test: this verifies whether two variable estimations
have similar means for a solitary gathering = One-Way ANOVA: this method
examines and gives an examination of change to a solitary treatment factor so
as to test a theory including a few distinct means A few clients will finish up
depending on General Linear Model highlights or even view the
"Non-parametric Tests" menu. Whichever way is an astounding method to
compare numerous means SPSS, however of course the change tests that the One-Way
ANOVA menu gives are normally better in any case. By and large the absolute
first means setting is the one that will be utilized in any case, so frequently
if some other way is being seen it won't really be as essential as it shows up.
So we reject our second hypothesis that there is no difference in experimental
and control group.
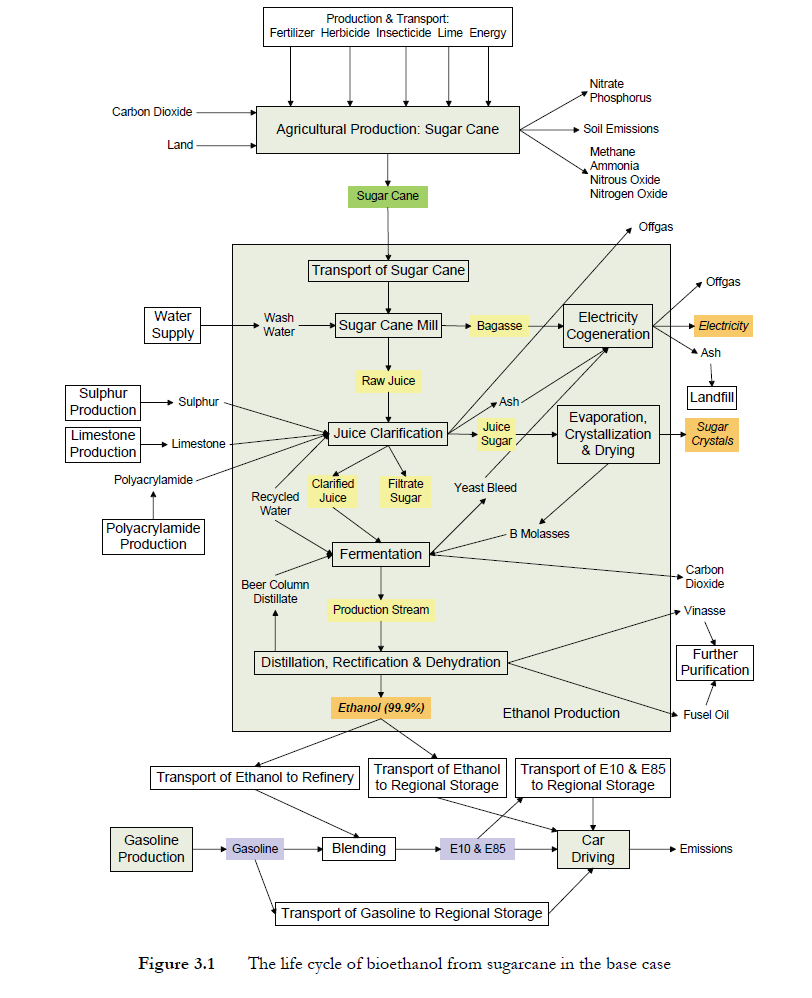
Life Cycle Analysis
The ethanol life cycle from sugarcane in the UK control group case
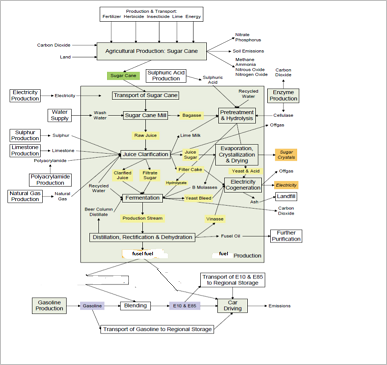
LCA Pakistan
In sugar industry of Pakistan alcohol is forbidden. Pakistan used totally Halal process of sugar making in sugar industries. This Halal technology process is differing from western sugar industry.
Figure6
The ethanol produced from sugar cane is a type of liquor-based fuel that's delivered when the molasses and sugarcane juice have already aged. Since it's a low-carbon and spotless biofuel, it has become a main source of transportation fuel.
Ethanol can be utilized two different ways:
1. Mixed with fuel at levels going from 5 to 27.5 % to decrease oil use, help octane evaluations and cut tailpipe outflows
2. Unadulterated ethanol – a fuel made up of 85 to 100 % ethanol relying upon nation particulars – can be utilized in uniquely structured motors
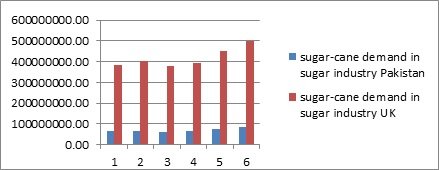
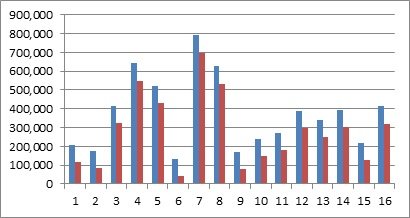
Micro Economic Analysis Demand Analysis
This analysis includes how supply demand differs in both groups and what are the key factors need to be discussed. Below graph shows that sugar-cane demand for sugar industry in UK is high than Pakistan. So its industrial base demands of sugar-cane.
Domestic demand of sugar
Domestic demand of sugar in Pakistan is more than Uk. This thing shows a cultural disparities because Pakistani are more inclined to use sweet dishes than UK.


Comparative Analysis of Domestic Demand Of Sugar In Uk & Pakistan
Due to taste effect and traditional disparities of
sweet dishes in eastern culture per capita sugar consumption is high in Pakistan as compared to UK.
Sugar-cane supply in UK & Pakistan
Sugar production area cultivation in Pakistan is more than uk. UK have to import sugar-cane to fulfill its industrial or domestic demand. But Pakistan export sugar-cane. Although UK have to imports sugar cane but its industrial unit is faster than Pakistan so sugar production per toned high in UK. UK imports sugar- cane from neighboring countries nut Pakistan is lucky enough because of its agricultural resources.
Conclusion
Findings of the research shows that market information and market strategies are main difference which creating difference in two industries. Ethanol becomes is source of earning in UK which is more inclined to use alcoholic product. So ethanol increase the profit of sugar industry in UK it have found to be minimal role Pakistan sugar industry. Demand and supply and cultural economic factors creates difference in sugar industry in both countries.
References
- Ajang, P. E. (2015). "Assessing the role of work Motivation on Employee Performance." (2007). Misha, Fathimath, Baiduri Binti Youshan, and Zubair Hassan. "The Effect of Employees Personality on Organizational Performances: Study on Prudential Assurance Malaysia Berhad (PAMB)." International Journal of Accounting, Business and Management 1(1), 1-10.
- Ali, A. S. A., Hussein, O. E., & Ali, I. M. (2013). "The Effect of Leadership Behaviors On Staff Performance In Somalia." Educational Research International 2(2), 197- 210.
- Alvi, A. K., Abdus, S. A., & Rizwan, H. (2014). "Relationship of perceived organizational support and employee engagement." Science International 26, (2), 949-952
- Armstrong, M., Brown, D., & Reilly, P. (2011). Increasing the effectiveness of reward management: an evidence-based approach. Employee Relations, 33(2), 106–120.
- Beach, L. R. (2015). The human element: Understanding and managing employee behavior. Routledge.Loya, R. (2013). U.S. Patent Application No. 09/182,434.
- Bitler, M. P., & Schmidt, L. (2011). Utilization of Infertility Treatments: The Effects of Insurance Mandates. Demography, 49(1), 125–149.
- Bivins, T. H. (2006). " Responsibility and accountability." Ethics in public relations: Responsible advocacy. 19-38.
- Bolden, R., Jonathan, G., Antonio, M., & Paul, D. (2003). A review of leadership theory and competency frameworks. Centre for Leadership Studies, University of Exeter,
- Brayfield, A. H., & Crockett, W. H. (1955). Employee attitudes and employee performance. Psychological bulletin, 52(5), 396.
- Dobre, O-I. (2013). "Employee motivation and organizational performance." Journal of Management and Socio-Economic, 5(1), 53-60.
- Elnaga, A., & Imran, A. (2013). The effect of training on employee performance. European Journal of Business and Management, 5(4), 137-147.
- Herzberg, F., Mausnes, B., Peterson, R. O., & Capwell, D. F. (1957). Job attitudes; review of research and opinion.
- Husain, Z. (2013)"Effective communication brings successful organizational change." The Business & Management Review, 3(2), 43-50.
- Jones, S. R. (1990). Worker interdependence and output: The Hawthorne studies reevaluated. American Sociological Review, 176-190.
- Kalimullah, N. A., & Doftori, M. R. (2010). Giving Voice: Making Evaluation Contextual for Marginalized Groups in South Asia. Bulk Sales.
- Khan, A. H., Nawaz, M. M., Aleem, M., & Hamed, W. (2012). Impact of job satisfaction on employee performance: An empirical study of autonomous Medical Institutions of Pakistan. African Journal of Business Management, 6(7), 2697-2705.
- Kum, F. D., Richard, C., & Anis, M. K. (2014). "The impact of training and development on employee performance: A case study of ESCON Consulting." Singaporean Journal of Business Economics and Management Studies 3(3), 72-105.
- Lindsay, C. A., Marks, E., & Gorlow, L. (1967). The Herzberg Theory: a critique and reformulation.
- Loughlin, C., & Barling, J. (2001). Young workers’ work values, attitudes, and behaviours. Journal of Occupational and Organizational Psychology, 74(4), 543– 558.
- Meuter, M. L., Ostrom, A. L., Roundtree, R. I., & Bitner, M. J. (2000). Self-Service Technologies: Understanding Customer Satisfaction with Technology-Based Service Encounters. Journal of Marketing,64(3), 50–64.
- Podsakoff, P. M., & MacKenzie, S. B. (1997). Impact of Organizational Citizenship Behavior on Organizational Performance: A Review and Suggestion for Future Research. Human Performance, 10(2), 133–151.
- Robbins, S. P. (2001) Organizational behavior, 14/E. Pearson Education India,.
- Roethlisberger, F. J. (1941). Management and Morale.
- Simpson, I. (2016). An industry update: what is new in the field of therapeutic delivery this month? Therapeutic Delivery, 8(6), 367–372.
- Sinha, S., Ajay, Kr., Singh, N., G., & Rajul, D. (2003). "Impact of Work Culture on Motivation and Performance Level of Employees in Private Sector Companies." Acta Oeconomica Pragensia, 49-67. O'Donnell, Orla, and Richard Boyle. "Understanding and managing organisational culture."
- Van Woerkom, M., Nijhof, W. J., & Nieuwenhuis, L. F. (2002). Critical reflective working behaviour: a survey research. Journal of European Industrial Training, 26(8), 375–383.
Cite this article
-
APA : Kausar, S. W. A., Khan, I. U., & Tahir, A. (2022). Investigate How Ethanol Production Effect Sugar Industry: A Case Study of UK & Pakistan. Global Economics Review, VII(IV), 51-69. https://doi.org/10.31703/ger.2022(VII-IV).05
-
CHICAGO : Kausar, Syed Waqas Ali, Imran Ullah Khan, and Aisha Tahir. 2022. "Investigate How Ethanol Production Effect Sugar Industry: A Case Study of UK & Pakistan." Global Economics Review, VII (IV): 51-69 doi: 10.31703/ger.2022(VII-IV).05
-
HARVARD : KAUSAR, S. W. A., KHAN, I. U. & TAHIR, A. 2022. Investigate How Ethanol Production Effect Sugar Industry: A Case Study of UK & Pakistan. Global Economics Review, VII, 51-69.
-
MHRA : Kausar, Syed Waqas Ali, Imran Ullah Khan, and Aisha Tahir. 2022. "Investigate How Ethanol Production Effect Sugar Industry: A Case Study of UK & Pakistan." Global Economics Review, VII: 51-69
-
MLA : Kausar, Syed Waqas Ali, Imran Ullah Khan, and Aisha Tahir. "Investigate How Ethanol Production Effect Sugar Industry: A Case Study of UK & Pakistan." Global Economics Review, VII.IV (2022): 51-69 Print.
-
OXFORD : Kausar, Syed Waqas Ali, Khan, Imran Ullah, and Tahir, Aisha (2022), "Investigate How Ethanol Production Effect Sugar Industry: A Case Study of UK & Pakistan", Global Economics Review, VII (IV), 51-69
-
TURABIAN : Kausar, Syed Waqas Ali, Imran Ullah Khan, and Aisha Tahir. "Investigate How Ethanol Production Effect Sugar Industry: A Case Study of UK & Pakistan." Global Economics Review VII, no. IV (2022): 51-69. https://doi.org/10.31703/ger.2022(VII-IV).05