- The study used service quality as a composite variable and did not check the effect of SQ dimensions like staff behavior and physical environment. In the hoteling business, both these factors have a more significant impact on customer satisfaction. So, future researchers must address these factors to explore the phenomena further.
- The study uses one possible mediator, namely satisfaction; however, other potential mediators like brand trust and the perceived value may also affect the relationship. To further elaborate on the situation, future researchers may also check the mediating effects of these variables.
- The study in hand was conducted in the hotel industry of Pakistan. Future researchers may replicate the same research in other services organizations where brand loyalty exert substantial influence.
- This study was conducted in Pakistan. Someone in future may replicate the same study in other culture.
- Bowen, J., & McCain, S. L. (2015),
- Bujisic, M., Hutchinson, J., & Parsa, H. (2014),
- Cunningham, R. M. (1956).
- Day, G. S. (1969).
- Dortyol, I., Varinli, I., & Kitapci, O. (2014),
- Durna, K., Dedeoglu, B., & Balikçioglu, S. (2015),
- Ekinci, Y., Dawes, P., & Massey, G. (2008),
- Field, A. (2013). Discovering statistics using IBM SPSS statistics. sage.
- Gemar, G., Moniche, L., & Morales, A. (2016),
- Grönroos, C. (1984),
- Gursoy, D., Chen, J., & Chi, C. (2014),
- Han, H., & Jeong, C. (2013),
- Harris, L., & Goode, M. (2004),
- Huberl, F., Herrmann, A., & Morgan, R. E. (2001). Gaining competitive advantage through customer valueoriented management, Journal of Consumer Marketing, 18, 41-53
- Imran, M., & Khattak, S. R. (2019),
- Jacoby, J., & Kyner, D. B. (1973).
- Hemsley-brown, J., & Alnwas, I. (2016), Service quality and brand loyalty, International Journal of Contemporary Hospitality Management, 28(12), 2772-2794
- Jani, D., & Han, H. (2015),
- Kandampully, J., Zhang, T., & Bilgihan, A. (2015),
- Khattak, S. R., Saima, B., Zafar, S., & Kousar, T. (2016).
- Lee, J., Capella, M., Taylor, C., Luo, M., & Gabler, C. (2014),
- Lin, J. S., & Liang, H. Y. (2011).
- Lo, A., Wu, C., & Tsai, H. (2015),
- Loureiro, S., Lopes, R., & Kaufmann, H. (2014).
- Muneeb, M. A. (2020). How Brand Image and Perceived Service Quality Affect Customer Loyalty Through Customer Satisfaction. Academy of Marketing Studies Journal.
- Molina-AzorÃÂn, J., TarÃÂ, J., PereiraMoliner, J., Lopez-Gamero, M., & Pertusa-Ortega, E. (2015),
- Nam, J., Ekinci, Y., & Whyatt, G. (2011),
- Namkung, Y., & Jang, S. (2010),
- Oliver, R. (1999),
- Oliver, R. L. (1993), A Conceptual Model of Service Quality and Service Satisfaction. In: T. A. Swartz, D. E. Bowen & S. W. Brown (Eds.), Advances in Services Marketing and Management, Greenwich, JAI. 65-86.
- Parasuraman, A., Zeithaml, A., & Berry, L. (1988),
- Peng, J., Zhao, X., & Mattila, A. (2015),
- Petrick, J. F. (2002). Development of a multi-dimensional scale for measuring the perceived value of a service. Journal of leisure research, 34(2), 119-134.
- Pizam, I., Shapoval, V., & Ellis, T. (2016),
- Prentice. (2013).
- Roig, J. C. F., Garcia, J. S., Tena, M. A. M., & Monzonis, J. L. (2006). Customer perceived value in banking services. International Journal of Bank Marketing, 24, 266-283.
- Sekaran, U., & dan Bougie, R. (2010). Research Method for Business, 5.
- Seri'c, M., Gil-Saura, I., & Ruiz-Molina, M. (2014),
- Su, L., Swanson, S., & Chen, X. (2016).
- Tsai, S. P. (2014). 'Love and satisfaction drive persistent stickiness: investigating international tourist hotel brands', International Journal of Tourism Research, 16(6),565-577.
- Woodruff, R. B. (1997). Customer value: the next source of comparative advantage, Journal of Academy of Marketing Science, 25, 139-153.
- Xu, J., & Chan, A. (2010), 'A conceptual framework of hotel experience and customer-based brand equity', International Journal of Contemporary Hospitality Management, 22(2),174-193
- Zemke, D., Neal, J., Shoemaker, S., & Kirsch, K. (2015),
Abstract:
The study in hand attempts to investigate the intervening role of satisfaction on service quality and reputation relationship with brand loyalty in the hotel industry of Pakistan. The sample of the current research was customers of the hotels operated in Khyber-Pakhtunkhwa. Based on convenience sampling, a total of 400 respondents were selected. A total of 356 questionnaires were received back, from which 345 were usable. Data were collected from the targeting customers through a structured questionnaire. The instrument validity and reliability were checked. The study found that reputation and service quality are significantly related to brand loyalty. The relationship between service quality and brand loyalty is did not mediated by satisfaction. Based on these results, the study recommended that the hotel industry give due importance to service quality, including physical environment, location, and staff behaviour, and reputation, to gain customer loyalty. In the end, we also recommend future directions to explore the phenomena further.
Key Words:
Satisfaction, Service Quality, Brand Loyalty, Reputation, Hoteling Industry
Background of the Study
There are two essential concepts in the hoteling industries: Brand loyalty (BL) and service quality (SQ), which has received momentous consideration in earlier studies. Significance of the service quality stems from his outcome on the loyalty of brand (Prentice, 2013; Gursoy et al., 2014), educating revisit intents, growing inclination for higher price payment (Zemke et al., 2015), dropping the possibility of hotels failures by improving the satisfaction (S) of customers and its significance, increasing customer
of company identifications, reducing operational expenses (Fida et al., 2020; Molina-Azorin et al., 2015) as well as improving the image of the whole business (Mehta, 2020).
Consequently, trailing service quality has an important component for a hotel aiming to stay alive and competitive. Likewise, in the latest literature, specific responsiveness has remained waged to the conception of BL in the hotel's industry (Mehta, 2020; Fida et al., 2020; Alam and Noor, 2020; Bowen & Mc-Cain, 2015) since its generates profit for the organization (Kandampully et al., 2015) in addition as it signifies a significant element of consumers-built equity of brand (Xu & Chan, 2010: Seric et al., 2014).
Although a remarkable numeral of research has examined service quality and loyalty association, little consideration has paid to an emotional role in this association (Han & Jeong, 2013). So, to addresses this space, some efforts have done in recent times to integrate emotional components in service quality and loyalty association to extend understanding of conception (Jani & Han, 2015; Su et al., 2015; Lin & Liang, 2011: Namkung & Jang, 2010: Han & Jeong, 2013). The research emphasises the roles of the service quality in impelling conditions of customer emotion (negative or positive) related to consumption within the context of services transfer.
Though even though these researches have a progressive understanding and the roles of emotion in services experience, they have never inspected different, precise and more profound practices of the customer's emotions, and they have never tested the degree to which service quality adds to increasing feelings concerning to the service brands. In this specific phase, the new paradigm has developed in marketing contexts known as emotional brand attachments (EBA), which blows intensely into an effective dominion and emphases different and specific emotional procedures as the cause of the development of the brands' loyalty. The emotional brand attachment (EBA) captures the strengths and deepens emotional links between customers and brands.
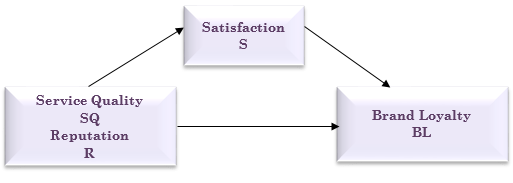
In view of the past studies, it is founded that there exists a considerable research gap to find the combined effect of SQ and R on BL (Jane & Ibrahim, 2016). Past research shows the relationship between customer’s perceptions about quality and linking it with loyalty, but this linkage is mediated by other factors requiring systematic investigation. Hence the present study will investigate the combined impact of the factors such as SQ, R, and customer satisfaction on BL in the Pakistani hotel industry. The study in hand also check the actual variations caused due to the combined impact of the mentioned variables on brand loyalty. Besides this, the study in hand also checks the effect of the emotional brand attachment variable, namely reputation, on BL.
Literature Review
Service quality characterizes customers’ valuation and aggregated differentiation of the particular service or perceived evaluation (Grönroos, 1984). The perception may be split into two different concepts in service quality, which may be the US perspective and the Nordic perspective (Parasuraman et al., 1988). The first US perspective depicts the SERVQUAL model (commonly recognized); the model composes different five dimensions such as reliability, empathy, tangibles, assurance, and responsiveness (Pizam et al., 2016). It’s worth mentioning to note the point that scholars adapted and forwarded their remarks as propositions about the diversity of the SERVQUAL model. Moreover, the various segments of the model were also proposed for other literature to be taken into account. The model has widely been lying spread over the existing literature; however, two points of criticism have been added to the literature based on the contradiction to its content.
Another perception unfolds the dimensions of service quality in overall expressions, and those consists of two different components, the technical quality and functional quality (Grönroos, 1984). Attendance support advocates the perception of the perspective having the view of its validity, standing parallel to the design when it applies to numerable industries in general and hospitality industries (Loureiro et al., 2014: Ekinci et al., 2008; Nam et al., 2011). Nordic school of thoughts (Nam et al..,2011) recommends two dimensions as employee’s behaviors and physical quality, to order the concept of SQ. The physical quality is defined as the good, material, design, and features of a particular hotel. However, the hotel crew may reflect the image in the form of responsiveness, competence, friendliness, and how to help their customers (Nam et al., 2011). Service quality as a dimension for measuring the variable has been adopted by followed Ekince et al. (2008).
Customers’ loyalty and repeat purchase were intermixed as similar concepts (Cunningham, 1956). Nevertheless, the behavioral dimension in the account of purchase behavior was severely criticized by researchers in general and by Day (1969). The purchase decision was demarcated into two different dimensions as attitudinal and behavioral. A positive attitude can lead a customer to make a favourable decision for purchases.
Nonetheless, the customers’ purchase decision approach was criticized with a rational yielding that repeat purchase and attitudinal bases are difficult to comprehend. Though, Day (1969), an advocate of repeat purchases and attitudinal decisions, states that repeat purchases make the concept of purchase frequency and further build a measurement mechanism. Concurrently, Oliver (1993, 1999) depicts and supports the argument of Day (1969) and adds the concept of behavioral intention. Oliver (1999) defines customers’ satisfaction as customers assessing the brand experience with their expectations from the particular brand. Furthermore, service quality is elaborated as responsiveness, the performance to the service, Customers’ expectations regarding specific service builds on referrals, words of mouth, and experiences over the times and frequency one visits the service provider to take the service (Jacoby & Kyner,1973).
Customers’ satisfaction may be the milestone for a business entity to take the heavy half of the market. This increases the customers’ purchase frequency and recommendations to other customers, thus increasing profitability over business’ entity age. As the level of customer satisfaction goes up, customer loyalty towards the particular service or brand goes up and otherwise (Oliver, 1999). Furthermore, it boasts up the number of customers too, thus the market. Thusspreads with the passing time. Customers’ satisfaction is referred to the interactions made with them by staff in banking organizations. The interactions and experiences make their image and position.
The providers of services such as the banking sector require in keeping extended relations to guarantee customer loyalty. This happens once perceived the value of the service by the customers giving a higher competitive advantage over other competitors present in the market (Roig et al. 2006). The valued perceived have gained high significance as a critical factor in forecasting re-purchasing purpose (Gursoy et al., 2014). The perceived value has complicated and composite perceptions, always have definite distinctly via numerous scholars (Hubler et al., 2001).
Conferring to Zeithaml (1988), the perceived value of the products is utility valuation which customers received founded on customer’s perception which he would receive by thinking it. The study of Woodruff (1997) defines the perceived value of a customer as the assessment done of products attribute and feature performance with expectations and the goals customers in his thoughts while Roig et al. (2006) suggest the perceived value come as a tradeoff amongst perceived benefit and the perceived cost. Therefore, these definitions propose that customers’ value relies on the perception of customers rather than of suppliers or another stakeholder (Nam et al., 2011).
Proposed Hypotheses
Method Research Philosophy
The research philosophy deals with the source nature and improvement of knowledge. Though the knowledge idea creation may seem to be profound, we are engaged in the creation of knowledge; as part of concluding our dissertations, we will gather secondary data and involved in the analysis of data to respond to the study questions, and the solution marks the formation of new knowledge. Choosing an appropriate research study philosophy is an essential part of research methodology. The current study will adopt a positivism research philosophy because the researcher will collect the quantitative data through a structured questionnaire. The methodology which essentials to be adopted here is highly designed, involving the hypotheses testing and the statistical tools a quantitative method.
Population, Sampling Technique and Sample Size
The population of the study was the customers of the hotel industry of Pakistan. The sampling frame consists of customers of the hotel industry operating in Khyber Pakhtoonkhwa and Islamabad. The present study used a convenient sampling technique. The sample size for a multivariate analysis should be ten times greater than the numbers of antecedents of the research study (Sekaran, 2013). Further scholars claimed that the size of the sample more significant than 30 and lesser than 500 is acceptable also (Field, 2013), (Khattak et al., 2016), (Imran & Khattak, 2019). In view of the recommendations, this research study plan to select a sample of the 400 customers to administer survey questionnaires.
Research Instrument
Using the existing scales developed by past researchers mentioned below are used in this study. All instruments are modified according to the study context. A five-point Likert scale ranging from 1= strongly disagree to 5= strongly agree used to measure the instruments. To measure reputation, a scale developed by Petrick (2002) was adapted and used. To measure satisfaction, a questionnaire adopted from the study of Oliver (1993) was used. To measure brand loyalty, a scale developed by Haris and Goode (2004) was adapted and used to collect the data.
Empirical Results Table 1. Instrument Reliability
| S. No width="118" valign="top">Variable width="191" valign="top">Cronbach’s Alpha width="138" valign="top">No. of Items | > 1 width="118" valign="top">BL width="191" valign="top">.931 width="138" valign="top">8 | > 2 width="118" valign="top">SQ width="191" valign="top">.947 width="138" valign="top">10 | > 3 width="118" valign="top">R width="191" valign="top">.901 width="138" valign="top">8 | > 4 width="118" valign="top">S width="191" valign="top">.913 width="138" valign="top">10 |
| Variable width="125" valign="top">KMO width="374" colspan="3" valign="top">BTS Chi-Sq df Sig | > BL width="125" valign="top">.756 width="125" valign="top">2832.82 width="125" valign="top">28 width="125" valign="top">.000 | > SQ width="125" valign="top">.790 width="125" valign="top">4493.12 width="125" valign="top">45 width="125" valign="top">.000 | > R width="125" valign="top">.682 width="125" valign="top">2567.67 width="125" valign="top">28 width="125" valign="top">.000 | > S width="125" valign="top">.762 width="125" valign="top">2840.32 width="125" valign="top">45 width="125" valign="top">.000 |
| Items width="168">Component width="132" valign="top">Items width="171">Component | > BL1 width="168">.828 width="132" valign="top">R1 width="171">.809 | > BL2 width="168">.868 width="132" valign="top">R2 width="171">.780 | > BL3 width="168">.860 width="132" valign="top">R3 width="171">.787 | > BL4 width="168">.838 width="132" valign="top">R4 width="171">.637 | > BL5 width="168">.713 width="132" valign="top">R5 width="171">.831 | > BL6 width="168">.779 width="132" valign="top">R6 width="171">.802 | > BL7 width="168">.846 width="132" valign="top">R7 width="171">.704 | > BL8 width="168">.831 width="132" valign="top">R8 width="171">.811 | > SQ1 width="168">.798 width="132" valign="top">S1 width="171">.754 | > SQ2 width="168">.869 width="132" valign="top">S2 width="171">.783 | > SQ3 width="168">.894 width="132" valign="top">S3 width="171">.770 | > SQ4 width="168">.698 width="132" valign="top">S4 width="171">.750 | > SQ5 width="168">.757 width="132" valign="top">S5 width="171">.619 | > SQ6 width="168">.806 width="132" valign="top">S6 width="171">.825 | > SQ7 width="168">.858 width="132" valign="top">S7 width="171">.793 | > SQ8 width="168">.880 width="132" valign="top">S8 width="171">.781 | > SQ9 width="168">.834 width="132" valign="top">S9 width="171">.755 | > SQ10 width="168">.836 width="132" valign="top">S10 width="171">.670 |
| width="107"> BL width="107">SQ width="107">R width="107">S | > BL width="107">1 width="107">width="107"> width="107">
| > SQ width="107">.641** width="107">1 width="107">width="107">
| > R width="107">.518** width="107">.323** width="107">1 width="107">
| > S width="107">.014 width="107">.024 width="107">.503** width="107">1 |
The table highlighted above shows correlation matrix of the study variables. As depicted, both independent variables namely SQ and R are significantly correlated with dependent variable BL. It also confirms that there is no multicollinearity in the study variables as the correlation between independent variables is less than 0.7.
Table 5. Model Summary
| Model width="38">R width="71">R-Square width="127">Adjusted R-Square width="149">St. Error of the Estimate width="100">Durbin-Watson | > 1 width="38">.720 width="71">.519 width="127">.516 width="149">.733 width="100">2.219 |
| Model width="216" colspan="2" valign="top">Unstandardized Coefficient width="162" valign="top">Standardized Coefficient width="48" rowspan="2">t width="39" rowspan="2">Sig | > B width="109">Std. Error width="162">Beta | > Constant width="107">.288 width="109">.177 width="162">width="48"> 1.633 width="39">.103 | > SQ width="107">.560 width="109">.042 width="162">.529 width="48">13.36 width="39">.00 | > R width="107">.391 width="109">.045 width="162">.347 width="48">8.76 width="39">.00 |
| Model width="60">R width="73">R-Square width="47">F width="60">p width="60">R width="86">R-Square width="60">F width="34">p | > 1 width="60">.023 width="73">.006 width="47">.196 width="60">.657 width="60">.641 width="86">.411 width="60">119.54 width="34">.00 |
| Model width="77">coeff width="77">se width="77">t width="77">p width="77">LLCI width="77">ULCI | > Constant width="77">3.34 width="77">.179 width="77">18.63 width="77">.00 width="77">2.98 width="77">3.69 | > SQ width="77">.022 width="77">.051 width="77">.443 width="77">.65 width="77">-.077 width="77">.123 |
The coefficient of the relationship between SQ and S shows that SQ is insignificantly related with S.
Table 9. Coefficient
| Model width="77">coeff width="77">se width="77">t width="77">p width="77">LLCI width="77">ULCI | > Constant width="77">1.24 width="77">.219 width="77">5.67 width="77">.00 width="77">.811 width="77">1.67 | > S width="77">-.001 width="77">.046 width="77">-.03 width="77">.69 width="77">-.093 width="77">.08 | > SQ width="77">.678 width="77">.044 width="77">15.45 width="77">.00 width="77">.592 width="77">.76 |
| Model width="59">R width="72">R-Square width="67">F width="60">P width="54">R width="78">R-Square width="48">F width="39">p | > 1 width="59">.503 width="72">.252 width="67">116.42 width="60">.00 width="54">.591 width="78">.349 width="48">92.14 width="39">.00 |
| Model width="77">coeff width="77">se width="77">t width="77">p width="77">LLCI width="77">ULCI | > Constant width="77">1.673 width="77">.167 width="77">10.00 width="77">.00 width="77">1.344 width="77">2.00 | > R width="77">.505 width="77">.047 width="77">10.78 width="77">.00 width="77">.413 width="77">.597 |
Dependent Variable: S
The coefficient of the relationship between R and S shows that R is significantly related with S.
Table 12. Coefficient
| Model width="77">coeff width="77">se width="77">t width="77">p width="77">LLCI width="77">ULCI | > Constant width="77">2.135 width="77">.199 width="77">10.72 width="77">.00 width="77">1.74 width="77">2.52 | > S width="77">-.370 width="77">.056 width="77">-6.55 width="77">.00 width="77">-.48 width="77">- .25 | > R width="77">.770 width="77">.056 width="77">13.57 width="77">.00 width="77">.65 width="77">.88 |